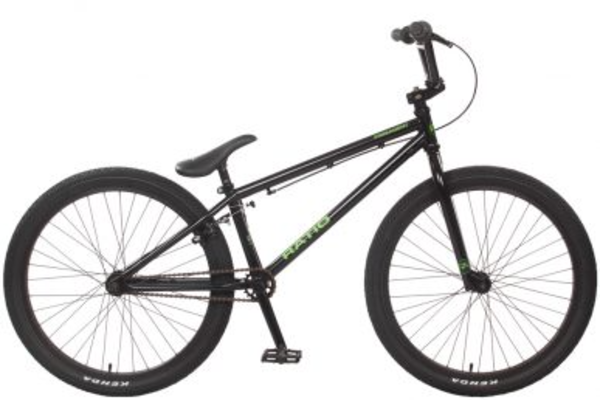
2022 Ratio
Used value range and market pricing for the 2022 Ratio · $566 - $658.
2022View valuesFree Agent Ratio
See year-by-year used values for the Free Agent Ratio. Compare model years and find out what a Free Agent Ratio is worth based on real marketplace sales data.


Get an instant valuation based on real marketplace data. Free, no sign-up required.
Get Market ValueAverage resale value as % of original retail - Free Agent vs. category average
Used value range and market pricing for the 2022 Ratio · $566 - $658.
2022View values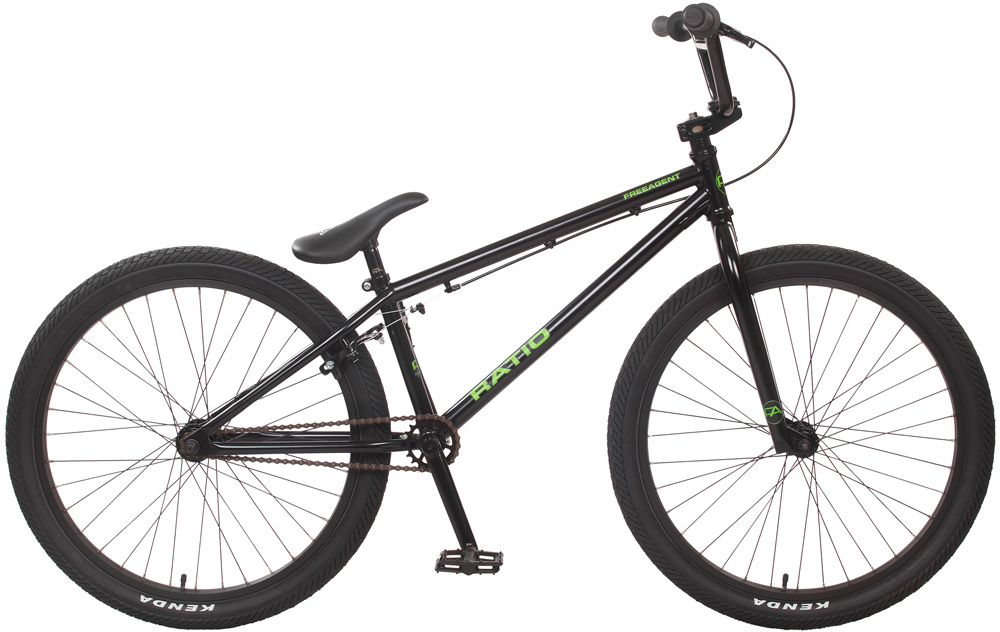
Used value range and market pricing for the 2021 Ratio · $455 - $528.
2021View values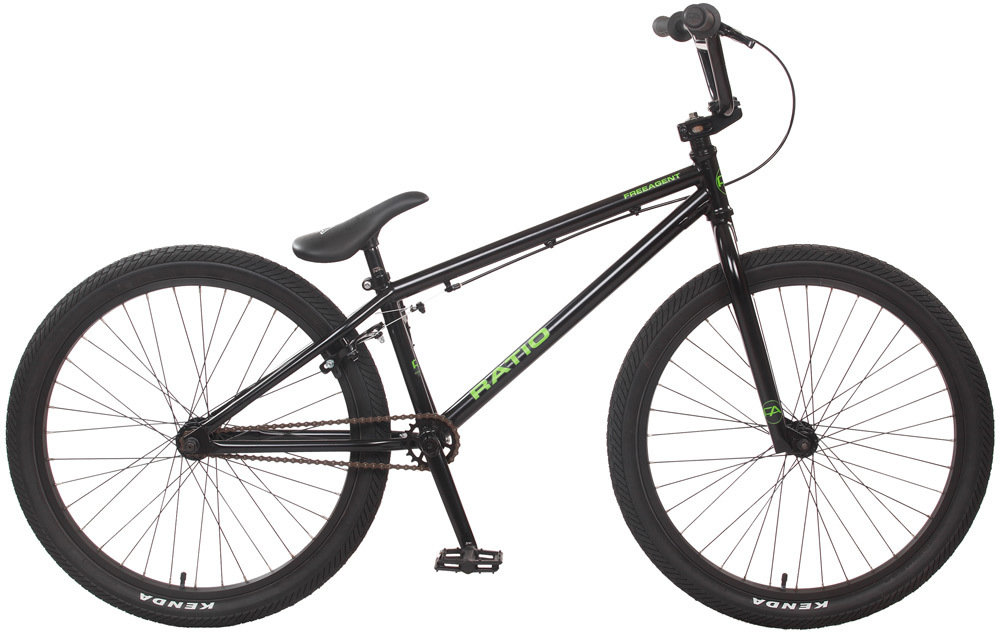
Used value range and market pricing for the 2020 Ratio · $427 - $496.
2020View values
Used value range and market pricing for the 2017 Ratio · $436 - $507.
2017View values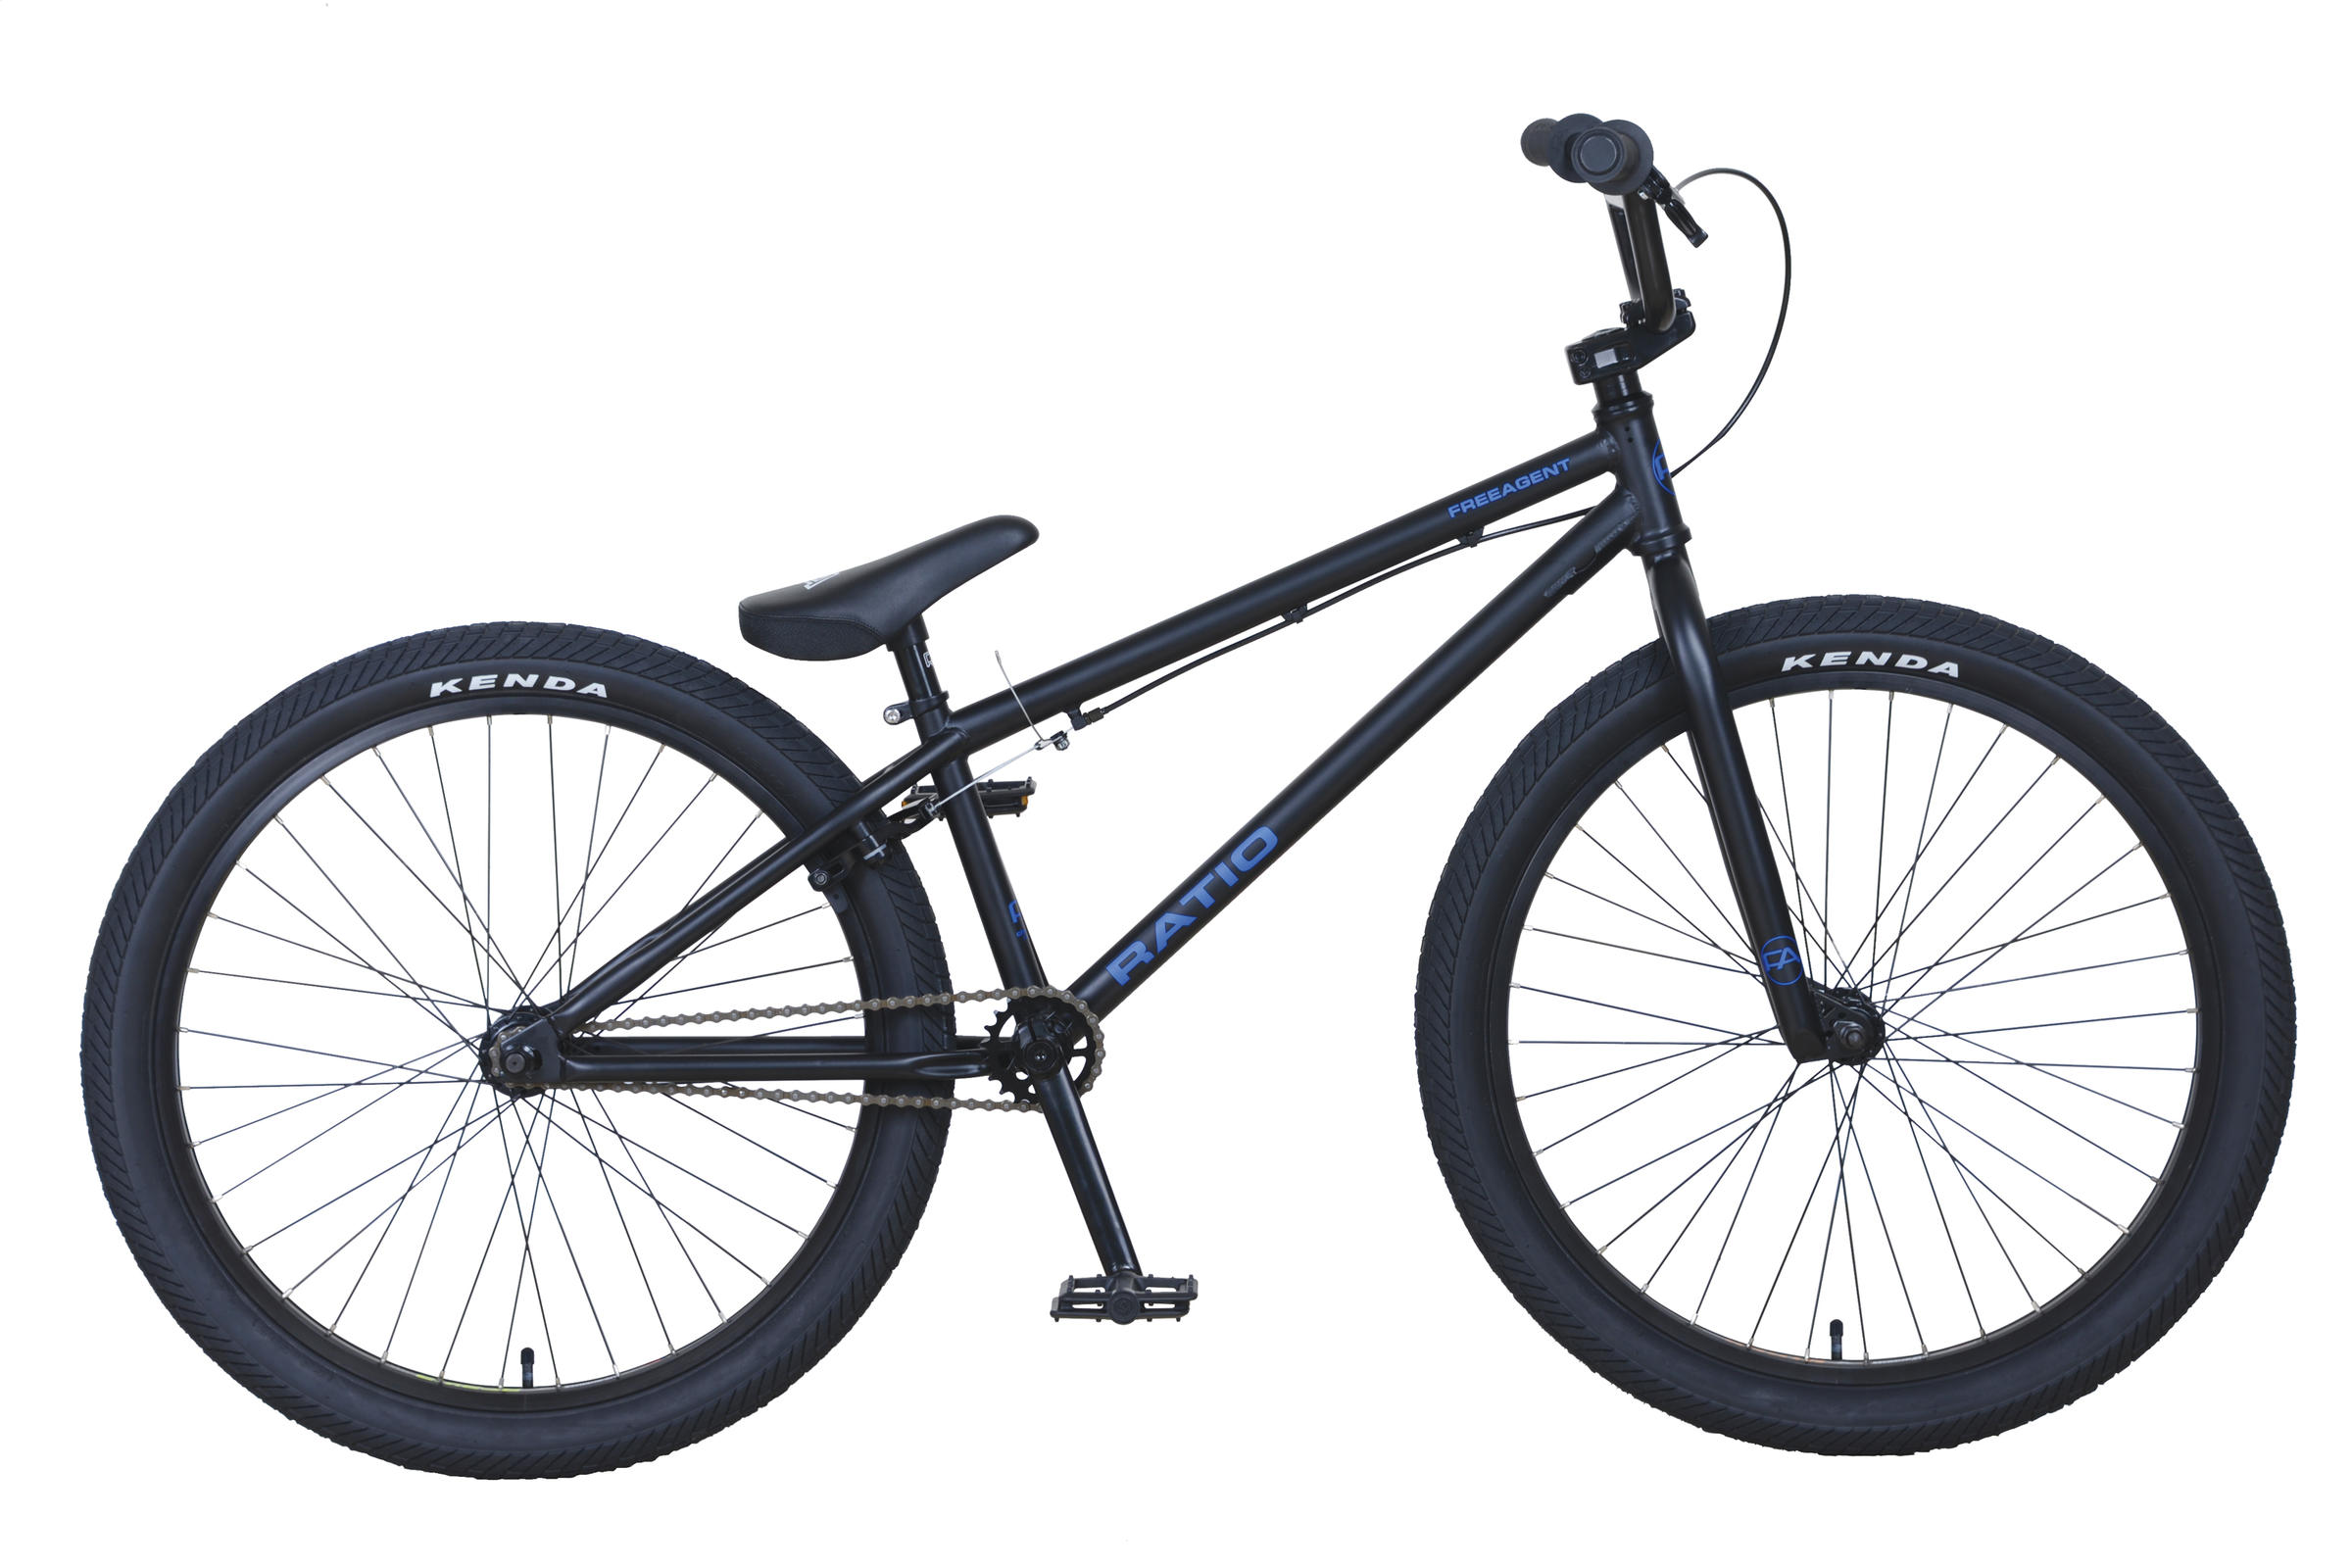
Used value range and market pricing for the 2016 Ratio · $436 - $507.
2016View values
Used value range and market pricing for the 2015 Ratio · $445 - $517.
2015View values
Used value range and market pricing for the 2014 Ratio · $445 - $517.
2014View values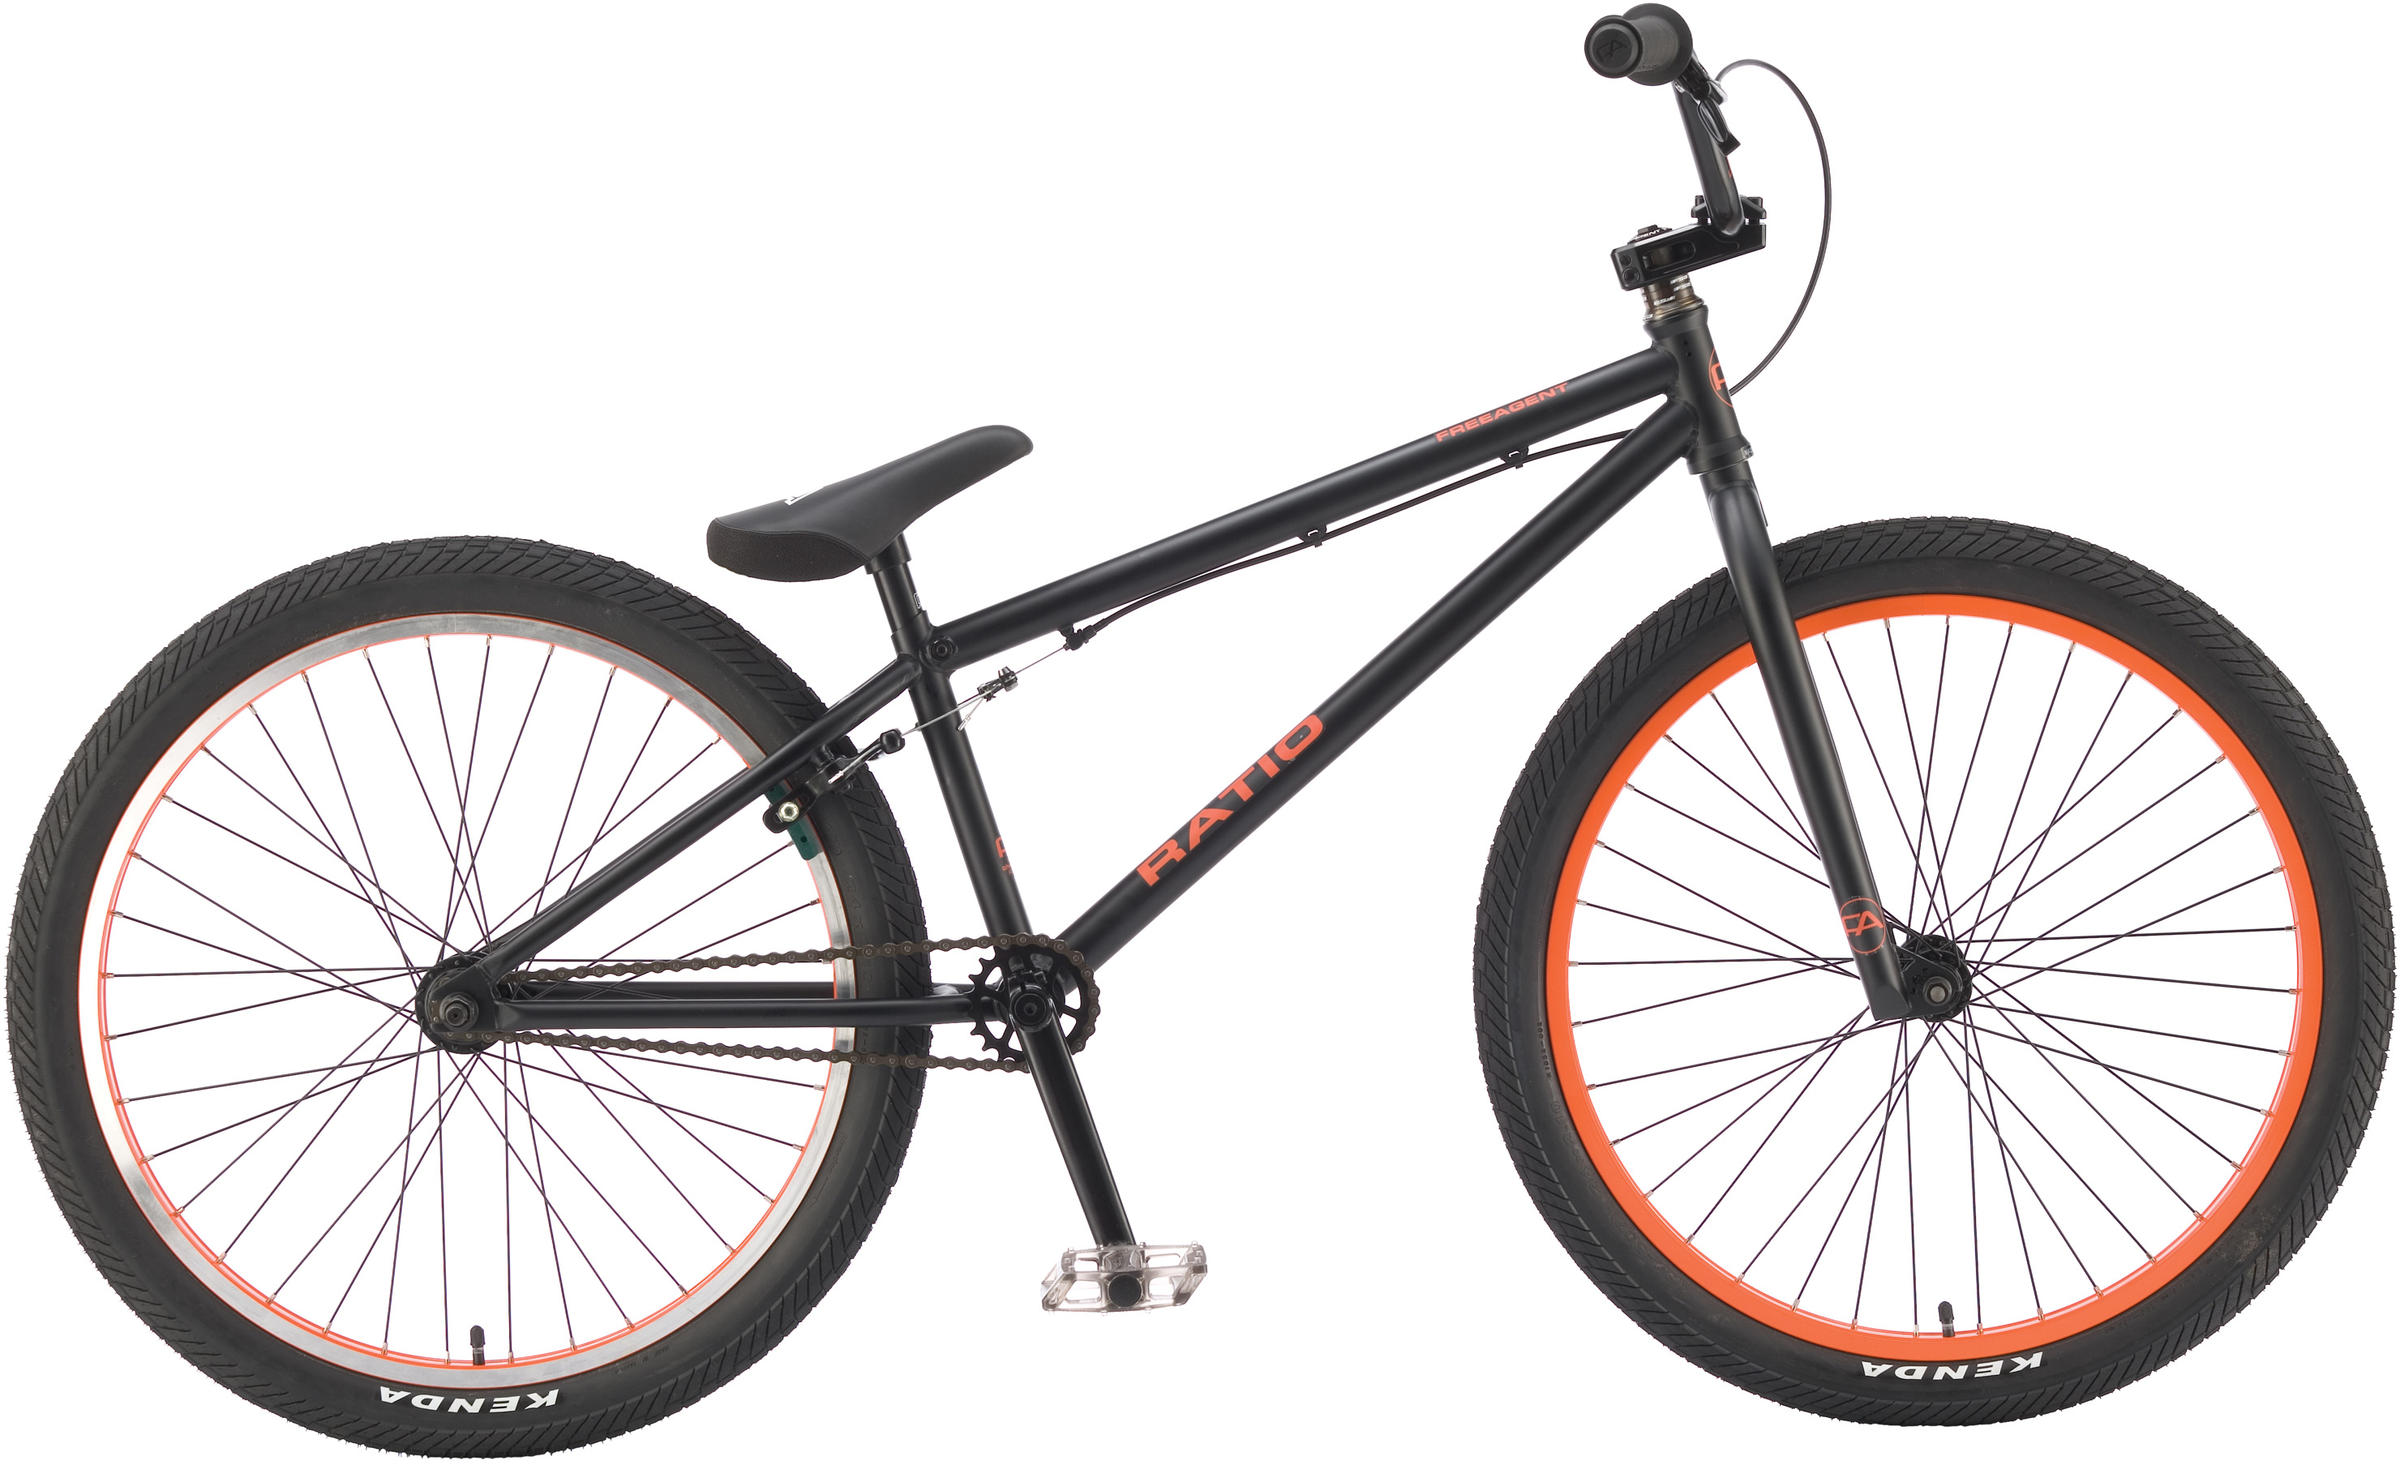
Used value range and market pricing for the 2013 Ratio · $445 - $517.
2013View values
Used value range and market pricing for the 2012 Ratio · $408 - $474.
2012View values